How do I create graphs?
- Create a new graph. Once you have created at least one table in CODAP, click the graph button
on the top toolbar.
- Note: Graphs start as a configuration of randomly scattered data points.
- Drag attributes (variables) from the column headers of the tables onto the horizontal (x) and
vertical (y) axes to view a graph of those variables.
- Create additional graphs to explore different relationships.
How to edit graphs
- Drag axes to change the graph's scale and origin.
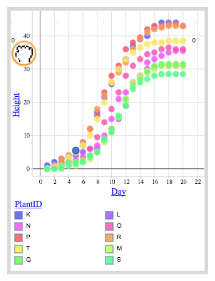
- Drop an attribute onto the center of a graph to color the display according to the attribute.
- Change the graph axes. Drag new attributes to the axes. Or click on the axis title to display a
menu of attributes.
- Click on the ruler menu item: to show or hide connecting lines between points, add a moveable
line to your graph, or plot any of a wide variety of functions on top of the graph's data.
Next: How do I read the values of a point?