By default, all the data shows up on a graph. Often you want to look at one run or
a set of runs for which only one variable is changing. There are several ways to do this:
Select the runs from the table by highlighting the rows (click and drag).
Those rows that are highlighted in the table will also be highlighted in the graph.
Drag across the graph points you want highlighted.
Choose a single run from the row of numbers at the top of the graph.
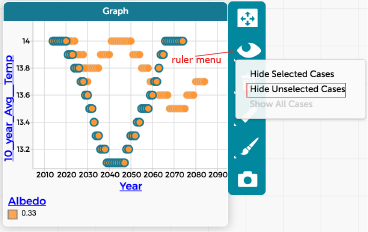
Use the Hide and Show function in the eye menu on the graph.
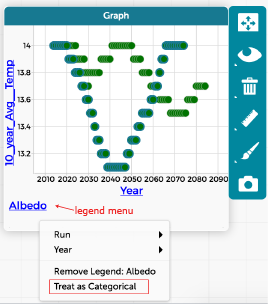
Color the datasets by attribute. Drag an attribute into the center of the graph
(making a legend) and choose Treat as categorical.